Improve Efficiency with These Software Development Metrics
Author
The TECHVIFY Team is a group of experienced professionals passionate about technology and innovation.
Programming may revolve around 1’s and 0’s, but measuring software development performance metrics is far more complex than a single number. For years, engineering managers have grappled with the challenge of quantifying development efficiency, given the numerous moving parts and unclear links between input and output. This has led to software development being seen as a “black box.”
But in today’s fast-paced, software-driven world, this perspective is no longer sustainable. Companies across industries are evolving into software companies, and modern engineering leaders recognize the need to align developer efforts with overarching business goals. The solution? A reliable set of Key Performance Indicators (KPIs).
According to a PwC survey, data-driven organizations are 3x more likely to report improvements in decision-making when tracking software development metrics effectively. When applied to software development, metrics provide the insights teams need to measure performance, track progress, and make informed decisions that foster continuous improvement. By leveraging these metrics, development teams can work smarter—not harder—and drive alignment with organizational objectives.
In this article, we’ll explore why development metrics matter, how to use them effectively, and the 15 essential metrics every data-driven team should track.
I. What Are Software Developer Metrics?
Software development metrics are measurable indicators that help you assess the performance, productivity, and quality of your development team. Think of these metrics as a way to get a clearer picture of how your team operates—what’s working, what’s not, and where you can improve.
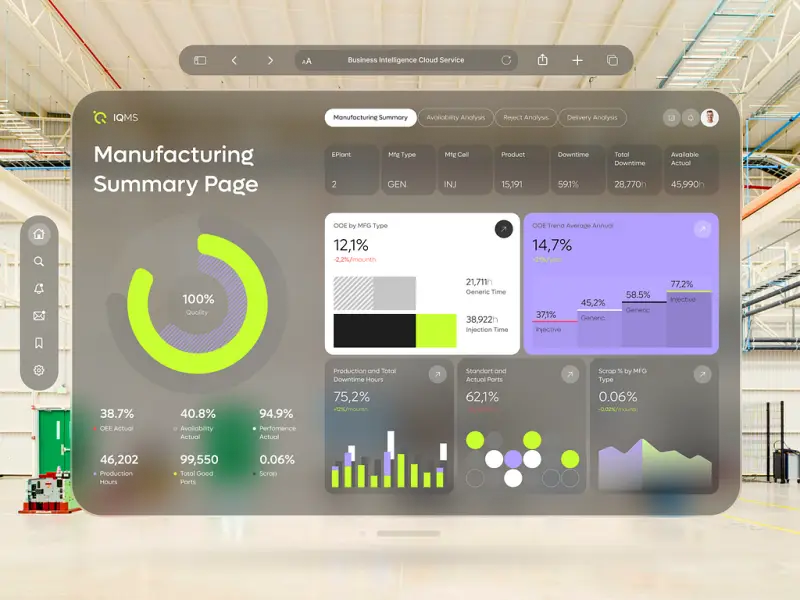
Understand software development metrics to stay ahead
These software development quality metrics cover a wide range of areas, from code-focused data points like defect rates and code complexity, to process-oriented measures such as cycle time, pull request review times, and deployment frequency.
By tracking software development metrics, you can:
- Spot inefficiencies: Identify bottlenecks or areas where processes could be improved.
- Boost code quality: Monitor defect rates and ensure that fewer bugs slip through to production.
- Enhance team collaboration: Understand how tasks are distributed and completed across the team.
But here’s the thing—metrics are only as good as how you use them. They’re not about micromanaging or assigning blame; they’re about providing insights that support your team. When balanced with qualitative feedback like team satisfaction or stakeholder input, developer metrics can foster a culture of continuous improvement.
Learn more:
II. Must Know Reasons to Measure Software Development Metrics
Measuring software development performance metrics isn’t just about numbers—it’s about gaining clarity, driving better decisions, and helping your development team thrive. Software development efficiency metrics give you visibility into what’s working, what’s not, and where to focus your energy. Here’s why they matter:
- Boost Productivity: Metrics make inefficiencies stand out. By identifying bottlenecks and waste, you can streamline workflows and help your team get more done with less effort.
- Elevate Quality: Tracking things like defect rates and test coverage ensures your team is delivering high-quality software. Metrics help you zero in on issues and continuously raise the bar for your product.
- Streamline Project Management: Great project management is all about data. Metrics empower project managers to anticipate challenges, adjust priorities, and allocate resources where they’ll make the biggest impact.
- Improve Stakeholder Communication: Metrics tell a story. They highlight progress, celebrate wins, and clarify challenges, helping you build trust and transparency with stakeholders.
That said, metrics aren’t magic. They’re tools to guide decision-making, not a one-size-fits-all solution. Over-relying on numbers without context can lead to missteps or oversights. The key is using metrics thoughtfully, pairing them with the full picture of your team’s work.
III. Top Software Development Performance Metrics Every Team Needs
Tracking the right software development performance metrics is essential to ensuring your software meets business goals and delivers value. These metrics give you a clear picture of your team’s performance, the quality of your processes, and your ability to meet client expectations. Let’s dive into some of the most important metrics every team should measure and why they matter.
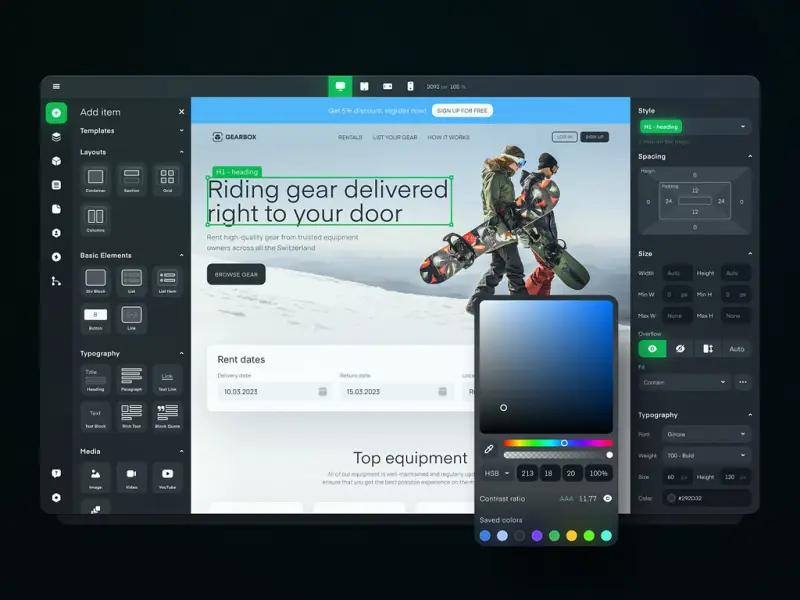
Calculate software development quality metrics for your project
1. Code Coverage Percentage
Code coverage is one of the most important software development quality metrics for assessing the reliability of your test suite. It measures the percentage of your source code that is executed during automated tests. By tracking this metric, you can identify areas of your code that aren’t being tested, which may leave gaps that could lead to bugs slipping into production.
The higher your code coverage, the more confident you can be in your testing process. While achieving 100% coverage is unrealistic (and often unnecessary), aiming for 80% coverage is generally considered a good benchmark. This ensures most of your critical functionality is tested without wasting time on diminishing returns.
Why it matters: A low code coverage percentage points to untested areas that could introduce risk. By increasing coverage, you’ll improve software reliability and decrease the likelihood of bugs reaching production.
2. Pull Request Size
Pull request size might not seem like an obvious performance metric, but it’s a crucial one. This metric tracks the number of code changes introduced in a single pull request. Smaller pull requests are easier to review, reduce the risk of undetected bugs, and allow for faster feedback cycles.
Large pull requests are harder to review thoroughly, which increases the likelihood of bugs slipping through. By encouraging smaller, more manageable pull requests, you improve code quality and make the review process more efficient. While there’s no universal rule for the “right” size, keeping pull requests concise ensures changes are easier to understand, test, and approve.
3. Deployment Frequency
Deployment frequency tracks how often your team releases code to production. Whether you’re releasing daily, weekly, or monthly, this metric reflects your team’s ability to deliver value consistently.
Frequent, smaller deployments reduce the risk of big errors and make it easier to identify issues when they arise. If your team struggles with infrequent or delayed deployments, breaking work into smaller, more manageable pieces can help you ship more often with less stress.
4. Cycle Time and Lead Time
What they measure:
- Cycle Time: The time it takes for a task to move from “in progress” to “done.” This metric reflects how quickly your team can deliver work once development begins.
- Lead Time: The time between when a request is made and when it’s live in production. Lead time includes everything from planning to deployment, making it a key measure of your overall delivery speed.
These metrics are critical for understanding your team’s efficiency. Shorter cycle times mean faster delivery, while shorter lead times indicate your team’s ability to respond quickly to customer needs and changing priorities.
5. SPACE Metrics
Developed by GitHub and Microsoft, SPACE metrics take a holistic view of developer productivity by considering technical performance and the human factors that impact success. These metrics focus on aspects like:
- Developer satisfaction.
- Efficiency of workflows.
- Collaboration and communication quality.
- Overall team well-being.
Productivity isn’t just about completing tasks—it’s about ensuring developers are motivated, supported, and working in an environment that fosters creativity. By tracking SPACE metrics, you can identify areas where the development process or culture may need improvement, such as simplifying review processes, improving documentation, or addressing workload imbalances.
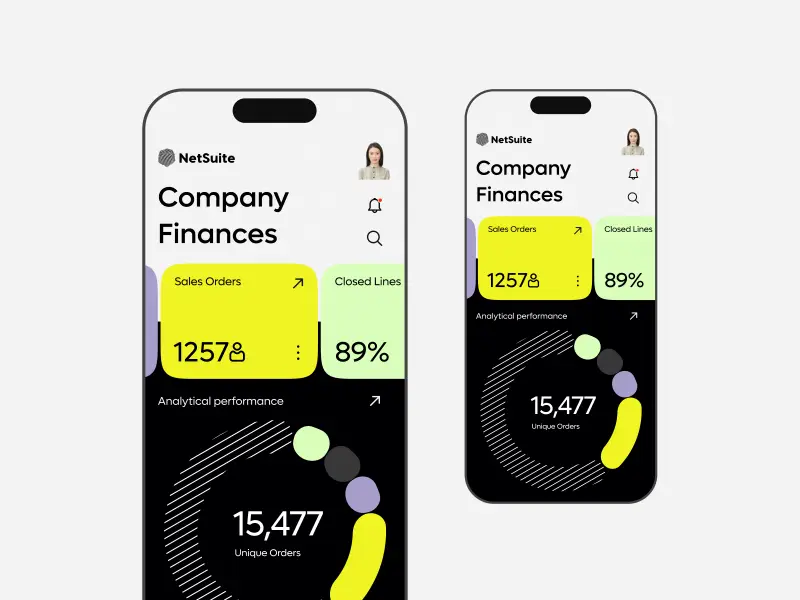
Software development efficiency metrics
6. Scope Completion Ratio
While velocity estimates how much your team can deliver, scope completion ratio measures how much of the planned work was actually completed during a sprint. It focuses on the percentage of tasks delivered versus tasks planned.
Low completion ratios can indicate deeper issues, such as:
- Teams being overcommitted or under-resourced.
- Bottlenecks or unaddressed task dependencies.
- Developers waiting on unblocked tasks or switching between tickets too often.
By monitoring this metric, you’ll gain insight into whether your team’s workload is realistic and where adjustments are needed.
7. Employee Net Promoter Score (eNPS)
Similar to customer Net Promoter Scores, eNPS measures how likely your employees are to recommend your company as a great place to work. It provides quick, actionable insight into employee satisfaction and engagement.
The eNPS survey asks a simple but powerful question: “How likely are you to recommend your workplace to others?” Responses are scored on a scale from 0 to 10, with 0–6 being detractors, 7–8 being neutral, and 9–10 being promoters. The formula for eNPS is:
eNPS = %Promoters – %Detractors
Why it matters: A high eNPS indicates a healthy and engaged workforce, while a low score signals dissatisfaction and potential retention risks. By addressing eNPS feedback, you can improve your team’s experience and foster a more productive, motivated environment.
8. Workflow Metrics
Workflow metrics are a key part of software development efficiency metrics, helping you understand how tasks move through your team’s pipeline. They help you understand where time is being spent and where bottlenecks are slowing progress.
- Cumulative Flow: This visual metric shows the number of tasks in each stage (e.g., backlog, in progress, completed) over time. If tasks are piling up in “in progress” or “backlog” stages, it’s a sign of bottlenecks or inefficiencies.
- Flow Efficiency: This measures the percentage of time tasks spend in active development versus waiting in queues. Use the formula:
Flow Efficiency = (Active Development Time / Total Time) × 100
By identifying where tasks are getting stuck, you can optimize your delivery pipeline, reduce wait times, and keep work moving smoothly.
9. Change Failure Rate (CFR)
CFR is the percentage of deployments that result in failures, such as downtime, bugs, or other issues. For example, if your team deploys 100 changes in a month and five cause failures, your change failure rate is 5%.
A low CFR (5–10%) reflects good code quality and strong testing practices. A high CFR, on the other hand, signals the need for better testing, debugging, or deployment processes. Monitoring CFR helps you minimize disruptions and maintain system reliability.
Looking for an Outsourced Software Development partner?
TECHVIFY is the best option for you. Book a free consultation for an accurate time and cost estimation for your project.
10. Development Velocity
Development velocity tracks how much work your team completes in a given time (usually a sprint). It’s typically calculated using story points, which reflect the effort required to deliver a task from the backlog. By analyzing velocity across several sprints, you can better estimate timelines and workload capacity.
For example, if your team completes 120, 100, and 140 story points across three sprints, their average velocity is 120 points per sprint. This means you can reasonably estimate that completing 600 story points will take about five sprints.
Velocity helps you set realistic expectations for your team and stakeholders. However, it’s not just about the raw numbers—it’s the trends that matter. Track velocity over multiple sprints to spot patterns and adjust for recurring challenges.
11. Escaped Defects
Escaped defects measure the number of issues that make it past your QA process and into production, where they’re experienced by end users. This metric is key for Agile teams striving to improve the effectiveness of their testing and development processes.
By tracking escaped defects, you can identify gaps in your testing pipeline and refine your processes to catch issues earlier. For example, you can compare the number of defects found before release to the number discovered post-release.
High escaped defect rates can indicate:
- Insufficient testing coverage.
- Tight deadlines that didn’t allow enough time for thorough QA.
- Gaps in catching edge cases during development.
By addressing these issues, you can reduce post-release failures, minimize customer frustration, and build a more reliable product.
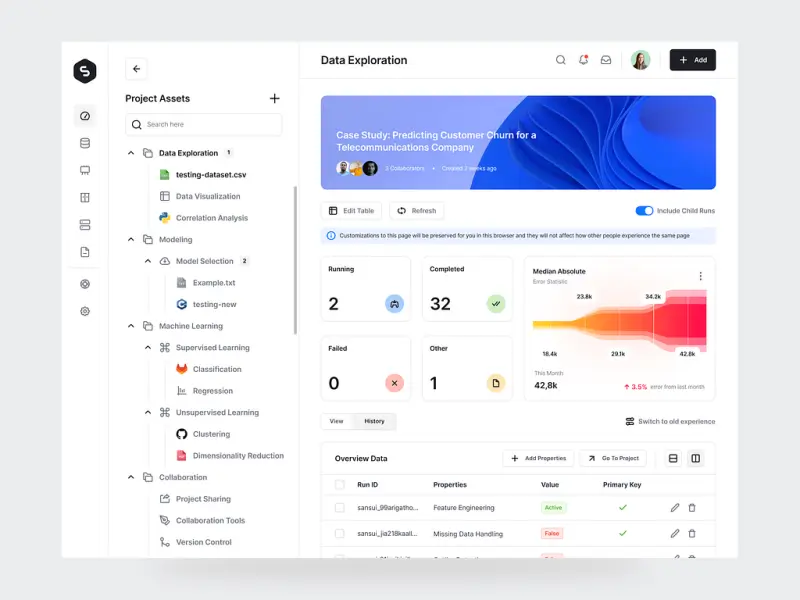
Software development performance metrics
12. Scope Added After Sprint Start
This metric tracks how much new work is introduced after a sprint begins. While some scope changes are inevitable, consistently adding tasks mid-sprint can disrupt progress and derail priorities.
A high scope-added rate typically points to gaps in planning or unclear requirements. To improve, engage stakeholders early in the process, clarify expectations, and implement stricter change management policies. Better planning upfront translates to smoother sprints and more predictable outcomes.
13. Customer Satisfaction Metrics
Happy customers are the ultimate goal of any software development effort. Tracking customer satisfaction metrics provides insight into how users perceive your product and how likely they are to stick around, upgrade, or recommend it to others.
Two key metrics to track are:
- Net Promoter Score (NPS): Measures how likely users are to recommend your product on a scale from 0 to 10. Scores of 9–10 indicate loyal advocates, while scores below 6 highlight areas where you may need to improve.
- Customer Satisfaction Score (CSAT): Tracks how satisfied users are with your software, calculated as the percentage of satisfied users out of all respondents.
Customer satisfaction metrics help you understand how well your product meets user needs and where you can focus your efforts to improve the customer experience.
14. Mean Time to Repair (MTTR)
MTTR calculates the average time it takes to recover from a failure in production. It reflects how quickly your team can identify and resolve issues, restoring services to normal.
Downtime can damage trust, credibility, and revenue. Whether it’s a SaaS platform or an e-commerce site, the faster you can recover from failures, the better. Tracking MTTR helps you identify patterns in incidents and improve your response processes, ensuring you’re prepared for the unexpected.
15. Usability Metrics
To truly understand how well your software resonates with users, you need to go beyond general satisfaction and dive into usability. Usability metrics measure how intuitive and user-friendly your product is.
One popular method is the System Usability Scale (SUS), which asks users to rate their experience based on statements like:
- “I found the software easy to use.”
- “I felt confident navigating the app.”
The results reveal how easily users can interact with your product and whether improvements are needed in areas like design, navigation, or feature accessibility.
Usability metrics give you clear, actionable feedback that can help you create a more user-friendly experience. This ultimately leads to higher adoption rates, better user retention, and stronger customer loyalty.
Learn more:
IV. How to Use Metrics to Drive Real Improvement
Metrics are only as good as the way you use them. To genuinely improve productivity, you need a clear and structured approach. The best way? Stop tracking everything and focus on what directly supports your goals.
The Goal/Question/Metric (GQM) method is a powerful way to do just that. It keeps things simple by breaking the process into three levels:
Goals (Conceptual Level): Start with what you’re trying to achieve. Are you looking to ship faster, improve code quality, or foster a healthier team culture? Defining your goals sets the foundation for everything else.
Questions (Operational Level): Once you know your goals, ask the questions that will help you measure progress. For example:
- “How quickly can we resolve bugs?”
- “Is our production environment stable?”
- “Are we hitting our release deadlines consistently?”
Metrics (Quantitative Level): Finally, assign metrics to answer those questions in a measurable way. For example:
- Mean Time to Resolution (MTTR) for tracking how fast you fix issues.
- Defect density for monitoring software quality.
- Deployment frequency for evaluating delivery speed.
The beauty of GQM is its flexibility. Whether you’re focused on improving technical quality, enhancing customer satisfaction, or strengthening team health, this approach helps you map out what to track and why.
Why GQM Works?
GQM keeps things focused. It stops you from drowning in irrelevant data and ensures that every metric you track has a purpose. By tying metrics to specific goals, it creates a clear connection between your team’s efforts and your business objectives.
Here’s how it helps:
- Clarity: GQM breaks big-picture goals into bite-sized, measurable objectives.
- Focus: It eliminates noise, keeping your team focused on what truly matters.
- Actionable Insights: By answering the right questions, you can turn metrics into meaningful improvement.
At the end of the day, metrics are about more than just data—they’re about helping your team make smarter decisions, work more efficiently, and achieve better outcomes. With the right approach, they’ll become a powerful tool for continuous improvement.
Conclusion
Tracking the right metrics is key to improving your team’s performance, boosting software quality, and aligning your efforts with business goals. Software development metrics aren’t just about numbers—they’re about driving better outcomes for your team, your product, and your customers.
If you’re looking to unlock the full potential of your development team, now is the time to take action. At TECHVIFY, we specialize in helping businesses streamline their software development process, improve performance, and deliver exceptional results.
Contact TECHVIFY today for a free consultation and discover how we can support your team with tailored development services that drive measurable results. Whether you’re optimizing processes or building software from the ground up, we’re here to make it happen.
TECHVIFY – Global AI & Software Solution Company
From Startups to Industry Leaders: TECHVIFY prioritizes results, not just deliverables. Accelerate your time to market and see ROI early with high-performing teams, AI (including GenAI) Software Solutions, and ODC (Offshore Development Center) services.
- Email:[email protected]
- Phone:(+84)24.77762.666