
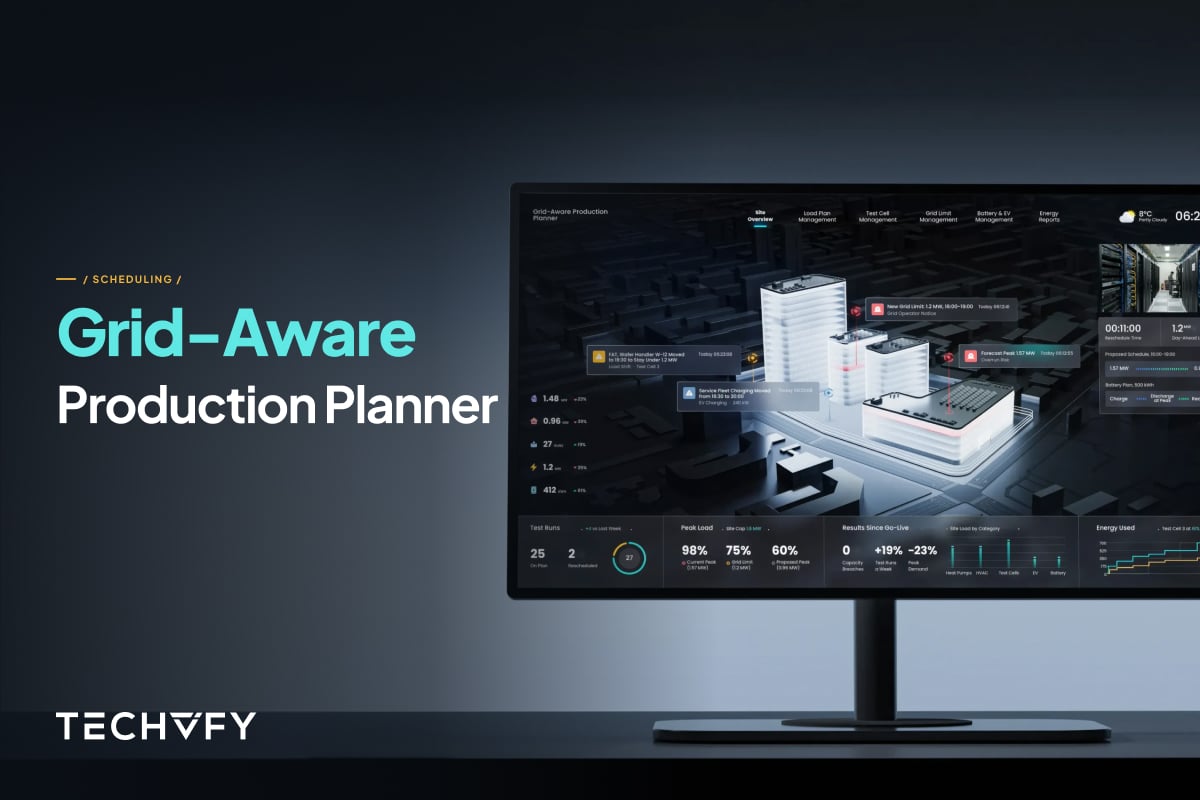
Grid-Aware Production Planning for a Dutch Machine Builder
The full case study is displayed below the introductory section!
Introduction
A Dutch machine builder designs and assembles high-tech production equipment, and every machine it sells runs through acceptance, burn-in and endurance tests in its own assembly and test hall before it ships. Orders were growing faster than the hall's grid connection, which the regional operator could not enlarge before the end of the decade, in a country where around 14,000 companies were still waiting for a connection of their own in late 2025.
Challenges
Test cells, heat pumps, base load and electric van charging all drew on one 1.6 MW connection, and the site only found out it had gone over once the limit was already breached.
- Output capped by the connection: Each test run draws several hundred kilowatts, so the number of tests the hall could run each week, and with it the number of machines the company could ship, was set by the grid rather than by demand.
- Breaches several times a month: With no forecast of what each run would draw, overlapping tests, heating and charging pushed the site past its contracted capacity several times a month.
- Limits that arrive the same morning: On a flexible connection the operator can cap an afternoon at short notice, and rebuilding the day's schedule by hand took around half a day.
- No single view of the site: Test cells, heating, the on-site battery and the van chargers were each run on their own, so nobody could see the whole load at once.
Solutions
Techvify built a scheduling layer over the site's existing equipment that meters every load, forecasts each test run before it starts and fits the whole day under the contracted capacity, with a planner approving every change. Over seven months, the team mapped every load in the hall with the site team, installed metering, built the forecast models and the scheduling engine, and then took the planner live alongside the site's own planners.
- Live metering across the hall: Edge meters on every test cell, heat pump and charger feed one live view, so the planner sees the real load against the 1.6 MW ceiling at any moment.
- A forecast for every test run: Load models built on past runs of the same machine type and test recipe predict each run's power draw phase by phase, landing within 4.5% of the actual peak on a typical factory acceptance test.
- A new plan when the grid tightens: When the operator caps an afternoon window, for example at 1.2 MW between 16:00 and 19:00, the platform moves the loads that do not fit, such as an acceptance test, a burn-in run and the vans' charging, and sends the new schedule to a planner's phone for approval.
- Battery and charging shifted around the limit: The on-site 500 kWh battery carries the hall through the limit window, while the eight service vans charge overnight and are full before the 07:00 shift.
Results
Six months after go-live, the site has not breached its contracted capacity once, down from several breaches a month. It runs 19% more tests a week on the same 1.6 MW connection, its peak demand is 23% lower than the year before, and a new grid limit becomes an approved schedule in 11 minutes instead of half a day of replanning by hand.
Scrollable & can be opened in Full Screen for the best viewing experience.